This is a topic that comes up every now and again 🙂 So let’s try to tackle it in a way that will be helpful. First let’s define the difference between inter- and intra-. This may be trivial for some folks, but I know I can get them mixed up on occasion.
Inter – between observers – number of different people
Intra – within observer – same person
Now, there are also 4 terms that are often associated with inter- and intra-observer reliability. These are:
- Accuracy
- Precision
- Validity
- Reliability
Different ways of thinking about these terms – which term means what?
- Are you measuring the correct thing? Are you taking a valid measurement? Are you measuring what you think you’re measuring? This is the ability to take a TRUE measure or value of what is being measured. VALIDITY or PRECISION!
- Are the measurements you are taking repeatable and consistent? Are you taking a good measure? How consistent are the results of a test? This is the RELIABILITY or the ACCURACY of a measure.
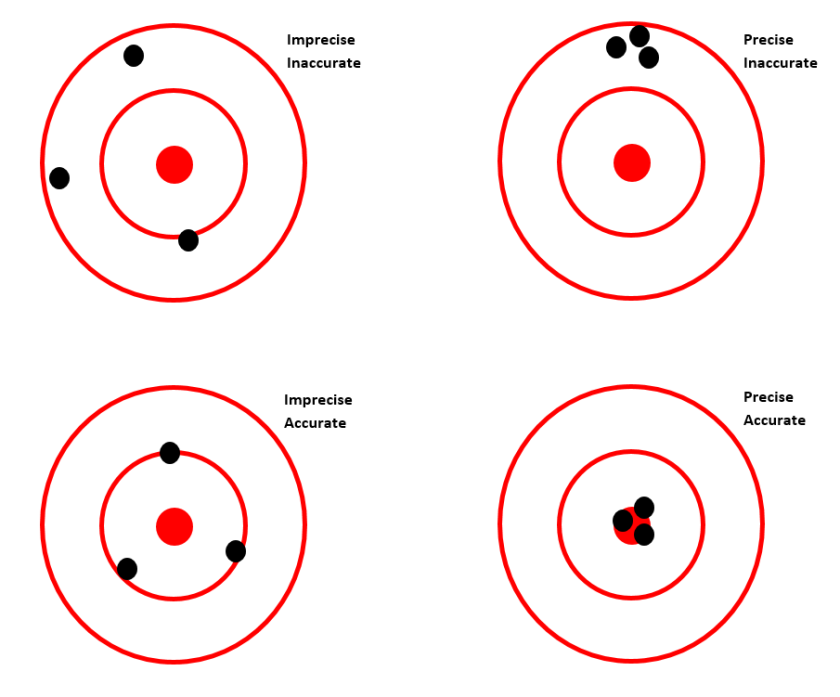
I saw this diagram and I think it provides a great visual to help us distinguish between these two terms.

Precision or Reliability – the ability to repeat our measures or our results – consistency
Accuracy or Validity – the ability to measure the “correct” measure
How do we measure Inter- or Intra-observer reliability?
Let’s start with Intra- In this situation, you have several measurements that were taken by the same individual, and we want to be able to assess how precise or reliable these measures are. Essentially, was the individual measuring the same thing every time they took that measure? Were the test results the same or extremely similar every time they were taken. We are NOT interested in whether we were measuring the “correct” thing at this time, only whether we were able to measure the same trait over and over and over again.
Inter-observer reliability is the same thing. Except now we’re trying to determine whether all the observers are taking the measures in the same way. As you can imagine there is another aspect to Inter-observer reliability and that is to ensure that all the observers understand what and how to take the measures. Are they measuring the SAME thing? We cannot assess this per say – but we can do our best in a research project to mitigate this problem by training all the observers, documenting the procedures on how to take the measures, and reviewing the procedures along with update training on occasion.
What statistical tests are available?
The type of data you are working with, will determine the most appropriate statistical test to use. The two most common tests are:
- % agreement using Nominal variables – Kappa
- Continuous variables – correlation coefficient
Example for Kappa calculation:
Instantaneous Observer1 Observer2 Observer 3
Sample Time
1 R R R
2 R R R
3 F W F
4 F F F
5 W W F
6 R R F
7 W W W
8 F F W
9 R R R
10 R R R
Where R=Resting; F=Feeding; W=Walking
Let’s calculate Kappa between Observer 1 and 2 together and then you can try the same set of calculations between Observer 1 and 3.
We first need to create a cross tabulation between Observer 1 and 2, listing the different combinations of behaviours observed during the 10 sampling times.
Observer 2 Observer 1 Prop. of total for Obs2
Measures: F R W
F 2 0 0 2/10 = 0.2
R 0 5 0 5/10 = 0.5
W 1 0 2 3/10 = 0.3
Proportion of total
for Observer 1 0.3 0.5 0.2
Kappa = (Pobserved – Pchance) / (1 – Pchance)
Pobserved = sum of diagonal entries/total number of entries = 9/10 = 0.90
Pchance = Sum of (Proportion for Observer 1 x Proportion for Observer2)
= (0.2 x 0.3) + (0.5 x 0.5) + (0.3 x 0.2) = 0.37
Kappa = (0.90 – 0.37) / (1 – 0.37) = 0.53/0.63 = 0.83
Now isn’t that nice and easy to calculate by hand? Give it a try for Observer 1 and Observer 3.
Kappa in SAS
Data kappa_test;
input timept observer1 $ observer2 $ observer3 $;
datalines;
1 R R R
2 R R R
3 F W F
4 F F F
5 W W F
6 R R F
7 W W W
8 F F W
9 R R R
10 R R R
;
Run;
Proc freq data=kappa_test;
table observer1*observer2 / agree;
Run;
To view the results please download the following PDF document.
Kappa in R
I used the R package called irr for Various Coefficients of Interrater Reliability and Agreement. Looking at only Observer1 and Observer2, here is the Rscript I used:
install.packages(“irr”)
library(irr)
observer1 <- c(“R”, “R”, “F”, “F”, “W”, “R”, “W”, “F”, “R”, “R”)
observer2 <- c(“R”, “R”, “W”, “F”, “W”, “R”, “W”, “F”, “R”, “R”)
x=cbind(observer1, observer2)
x
kappa2(x, weight=c(“unweighted”, “equal”, “squared”), sort.levels=FALSE)
The results are:
Cohen’s Kappa for 2 Raters (Weights: unweighted)
Subjects = 10
Raters = 2
Kappa = 0.841
z = 3.78
p-value = 0.000159
Guide to Interpreting the Kappa Statistic
The Kappa statistic can have a value from 0 to 1. Anything greater than 0.70 has been considered to be a great value and a sign of agreement. R
There are other statistics, such as Kendall’s coefficient of concordance used to calculate reliability, but Kappa and correlation coefficients are probably the most common.


Very well written and one of the simplest posts I’ve seen to understand cohens kappa! However, there is an error that confused me in the formula, you write Kappa = (Pobserved – Pchance) / (1 – Pobserved).
In the latter, (1-Pobserved), it is 1-Pchance no?
Sorry for the late reply! You are correct and it has been fixed. Thank-you for taking note