
Come visit my thoughts on this very interesting topic at Agricola Consulting.
Category: SAS
ARCHIVE: Introduction to SAS – Updated W22
Before we can start using the SAS program and learn how to write the code and match it to our data and trials, we need to be aware of different versions of SAS that we have access to.
Available Versions of SAS
- PC Standalone Version – PC-SAS or SAS 9.4
- Available for Windows ONLY – if you’re using a Mac, you will need to have a VM to emulate Windows to run this version
- Available through CCS Software Distribution Centre for a fee, please check https://guelph.onthehub.com/WebStore/Welcome.aspx for updated pricing and access information or email 58888help@uoguelph.ca for more information
- SAS OnDemand For Academics – SAS Studio
- Since this is a Cloud system – please recognize that your data and programs reside in the cloud and NOT on your local system, and you are using their computer resources NOT your own system – accessed through a web browser with your own personal login
SAS 9.4 & SAS Studio (OnDemand): What Parts of SAS do you have access to?
SAS is an extremely large and complex software program with many different components. We primarily use Base SAS, SAS/STAT, SAS/ACCESS, and maybe bits and pieces of other components such as SAS/IML.
- BaseSAS – base SAS programming, DATA Step
- SAS/STAT – the PROCs used for statistical analyses
- SAS/IML – SAS’ matrix programming language
- SAS/ACCESS – allows you to interact with different data formats
- Some parts of SAS/ETS – time series analysis
To see exactly what you have access to, you can run the following code:
Proc Setinit;
Run;
You will see the components available to you listed in the log window.

Also note the additional information available to you:
- License information
- Expiration date – very handy to be aware of, especially if you are running your own copy of your PC
- SAS components available to you
SAS 9.4: What does SAS look like?
There are a number of components to the SAS interface:
- Results and Explorer windows to the left
- Editor, Log, Output, and Results Viewer windows to the right, taking up most of the screen

SAS 9.4: What do each of these windows do?
- Results Window – a Table of Contents for all of your results.
- Explorer Window – similar to Windows Explorer – allows you to navigate SAS libraries and files
- Editor Window – this is where you will spend most of your time, writing and editing program files
- Log Window – this window is extremely helpful, think of it as your best friend in SAS, it tells you what SAS has done every step of your program and processing
- Output Window – SAS versions 9.2 and earlier, use this window to display all results and output. SAS 9.3 and higher use a new window called the Results Viewer. All the results are presented in an HTML format.
SAS Studio: What does SAS look like?
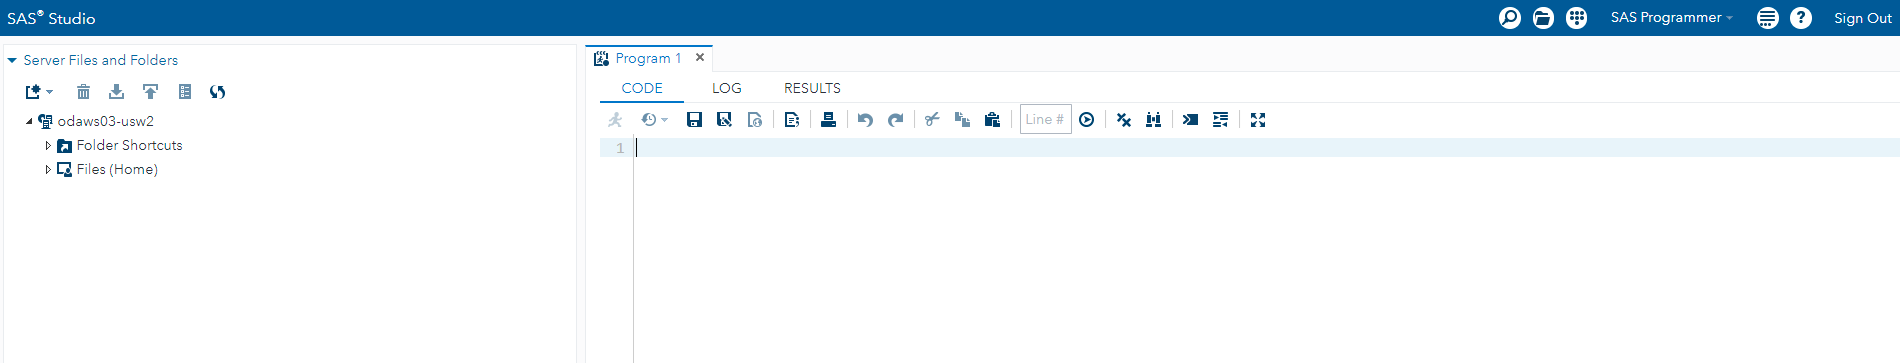
You’ll notice the same windows as SAS 9.4 – but called slightly different things. CODE = Editor; LOG = log; RESULTS=Results Viewer;
However, you’ll see a few handy items on the left-hand side of your screen in SAS Studio – items you will become very familiar with! But let’s dig into these as we work through getting our data in and so on – in the next part of our session.
How does SAS work?
SAS is divided into 2 areas:
- DATA step
- PROCs (short for PROCedures)
DATA step is all about data manipulation – one of the key strengths to SAS
PROCs – this is where you will find most of your statistical procedures.
Let’s Get Started with Reading Data
Notes to Reading Data into SAS are available as a PDF document for participants in the OAC W22 Intro to SAS workshop. If you did not participate in the workshop and would like a copy of the notes – please send me an email.
![]()
ARCHIVE: New workshops and new website??
I’m back! and feeling energized and very excited to be starting workshops again real soon! Ok May 4 will be the first set.
I’ll be offering SAS workshops on Tuesday mornings, R workshops on Tuesday afternoons, and what I like to call Crimes of Statistics workshops on Thursday afternoons. Yes, we’ll be continuing to use the TEAMS 0nline platform, and I encourage everyone who joins me to get involved in the workshops!
Where are the workshops? Too many to list here – so please visit the registration sites:
Tuesday workshops –https://oacstats_workshops.youcanbook.me/
Thursday workshops – https://oacstatstutorials.youcanbook.me/
Oh I did say something about a new website?? Well… it’s a Sharepoint site – it was fun to play around with it. What does this mean really? It’s a landing site for all of our workshops. I like to think of it as a one-stop-shop. Ok, I’m really hoping that it works out to be the one-stop-shop. If you drop by, let me know please!! Oops – would you like the link too https://uoguelphca.sharepoint.com/sites/OACStats_Workshops Now you can go check it out 🙂
Well that’s all the news for today – I’m aiming to keep this site a bit more moving along with my SASsyFridays blog – so stay tuned.
Take care everyone and get ready for that snow!!

ARCHIVE: Fall 2020 OACStats Workshops
Good day everyone! Yes! I will be offering workshops this semester. Please see the list of dates and topics below. Register for each date and time that you are interested in by visiting https://oacstats_workshops.youcanbook.me Once you register, I will send you a link to the TEAMS channel a day before or the morning of the workshops.
Tuesday, September 22 – 9 am: Introduction to SAS
Tuesday, September 22 – 1 pm: Introduction to R
Tuesday, September 29 – 9 am: Documenting your Analysis: R Markdown for R and SAS
Tuesday, October 6 – 9 am: SAS: Visualizing and Describing your data
Tuesday, October 6 – 1 pm: R: Visualizing and Describing your data
Tuesday, October 13 – 9 am: SAS: ANOVA – CRD and RCBD
Tuesday, October 13 – 1 pm: R: ANOVA – CRD and RCBD
Tuesday, October 27 – 9 am: SAS: Linear and mulitple regression
Tuesday, October 27 – 1 pm: R: Linear and mulitple regression
Tuesday, November 3 – 9 am: SAS: GLMM analysis
Tuesday, November 3 – 1 pm: R: GLMM analysis
Tuesday, November 10 – 9 am: SAS: Repeated Measures
Tuesday, November 10 – 1 pm: R: Repeated Measures
Tuesday, November 17 – 9 am: SAS: GLMM and Multinomial data
Tuesday, November 17 – 1 pm: R: PCA and Cluster Analysis
Tuesday, November 10 – 9 am: RDM: Managing your research data
Please contact oacstats@uoguelph.ca with any questions or special topics requests.

SAS: PROC GLIMMIX – Why are your students using it?
I’ve been talking about creating a workshop for faculty and research associates for a bit now. Well – it’s done! I’ve recorded a workshop (1 hour) that reviews ANOVA and SAS – and walks through 3 examples. To view the workshop – you will need a University of Guelph email, however, the powerpoint and SAS examples are linked here. Any questions, please let me know.
SAS example 1: PROC GLM, MIXED, GLIMMIX
